Project Deliverables

Project 1 - Modelling Tree Shade Coverage

Report and Dataset

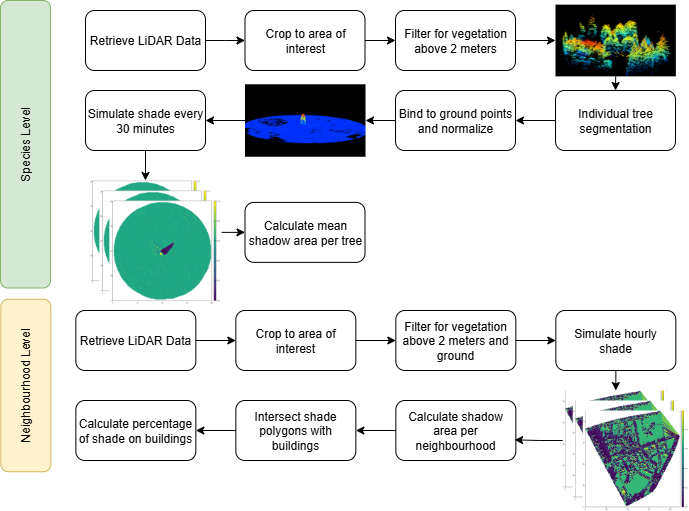
Tree Shade in UBC Neighbourhoods

Assessing the percentage of tree shade per neighbourhood that falls on buildings.

Example hourly tree shade from sunrise to sunset in Chancellor Place neighbourhood on a scale of 0 to 1, 0 being full shade.

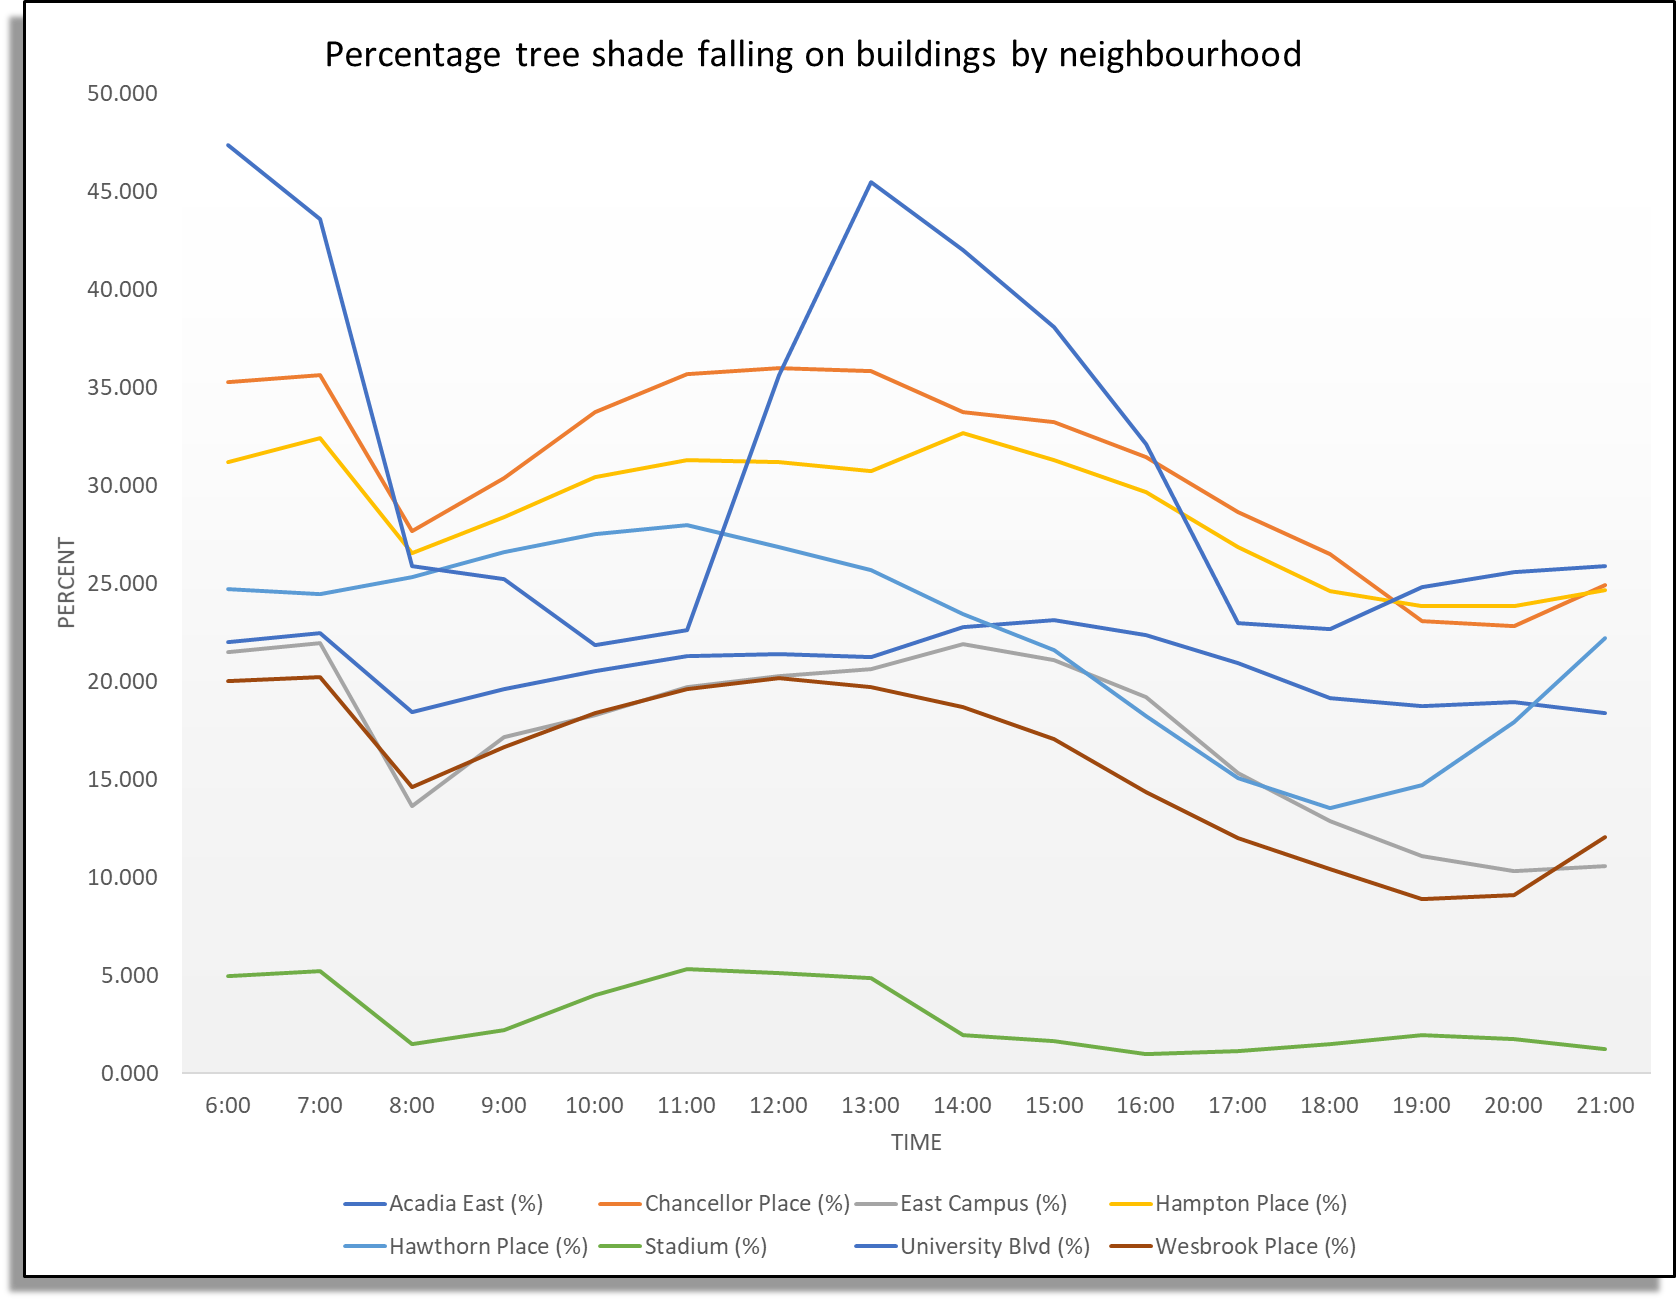
Percentage of tree shade falling on buildings per neighbourhood, hourly from sunrise to sunset.

Individual Tree Shade

Isolating the shade of individual trees for a species level analysis. Beginning from a point cloud clipped to a species of interest, ending with a shade model for a specific tree.

Scroll to zoom. Left-click to rotate.

Interactive point cloud for one area of interest filtered to display trees only.

Same interactive point cloud with the central tree isolated and normalized ground points added back in.

Example tree shade cast by an individual tree every thirty minutes.

Black pine, honey locust, and deodar cedar recommended for planting in low shade areas. While honey locust has a lower median, it is the species with individuals casting the most shade.

Shade Hotspot Map

Interactive map of climate change resilient shade across campus. Purple areas represent a high density of tall, climate change resilient tree species that tend to cast more shade.

Project 2 - Urban Heat Island Hotspots Montreal

The client for this project was Peter-Mcgill Community Table, looking to identify areas vulnerable to UHI in the district of Ville-Marie.

Risk level based on medium income across districts, population aged 65 or older, and population density.

Environmental risk factors map. Describes the likelihood of Urban Heat Island Effect.